
Tenant & Home Insurance in Mississauga: What It Actually Costs by Neighbourhood
Ontario home insurance premiums climbed 6.2% in the past year alone. But the province-wide number hides something more useful: within Mississauga itself, what you pay can swing by hundreds of dollars depending on flood exposure, sewer age, and how close you are to Pearson. Here's the average for every Mississauga postal code, from Rates.ca's 2026 data.
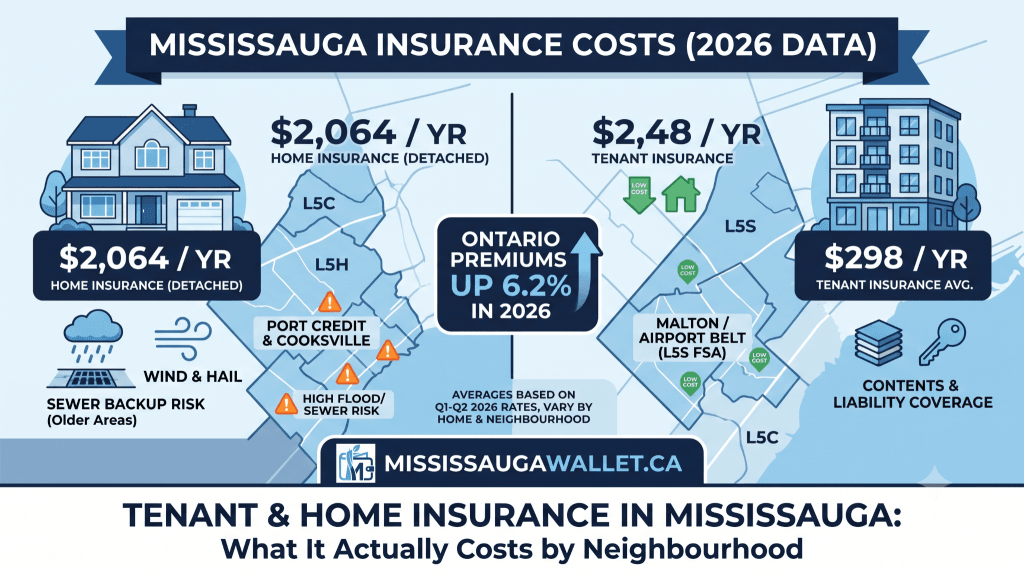
Every insurance comparison site will tell you Mississauga's "average" premium. Almost none of them will tell you that the average is close to meaningless if you're pricing a specific street. Insurers rate risk down to the Forward Sortation Area — the first three characters of your postal code — and in a city built from eight amalgamated villages with wildly different flood plains, housing stock, and distance from the lake, that means your actual number depends heavily on where in Mississauga you're looking.
This breaks down what Mississauga renters and homeowners are actually paying in 2026, why the neighbourhood-level swings happen, and what's realistically within your control.
1. What Mississauga households are actually paying
Two figures matter here, and they come from different methodologies, so it's worth being upfront about that rather than blending them into one misleading number.
| Insurance type | Mississauga average | How it was measured |
|---|---|---|
| Home insurance (detached) | $2,064/yr (~$172/mo) | Rates.ca Home Insuramap, Q2 2026 — priced on a 2,500 sq ft detached home, $500K rebuild cost |
| Home insurance (all dwelling types) | $1,472/yr (~$123/mo) | ThinkInsure customer premium data, 2024–25. Blends condos, townhomes, and detached homes of varying sizes |
| Tenant insurance | $298/yr (~$25/mo) | Rates.ca Home Insuramap, Q1 2026 |
Both home insurance figures are legitimate. They're just answering different questions. The $2,064 figure tells you what a standard-sized detached house costs to insure; the $1,472 figure tells you what an average Mississauga policyholder across all dwelling types actually pays, which is lower because it includes condos and smaller units. If you're pricing a specific home, ThinkInsure's customers paid anywhere from $368 to $4,053 a year depending on size, age, and claims history.
On tenant insurance, Mississauga runs almost exactly at the provincial average: $298/yr here versus $302/yr across Ontario. That ranks it 28th of 68 Ontario municipalities and 15th of 26 in the GTA. That's a notably better position than renters in downtown Toronto, who pay roughly 4% above the provincial average.
2. Why it varies so much by neighbourhood
Insurers price risk using five main categories: wind/hail, sewer or septic overload ("system backup"), theft, flood, and earthquake (a minor factor in Ontario). They apply these at the Forward Sortation Area level, which in a city as geographically varied as Mississauga means real differences from one side of a highway to the other.
Mississauga's citywide home average of $2,064 sits almost exactly in the middle of the GTA: 16th of 32 cities in Rates.ca's June 2026 ranking, between Caledon ($2,063) and Georgina ($2,095), and $171 below the Ontario average of $2,235. Inside the city, though, the spread between the cheapest and dearest postal code is $655 a year.
Find the first three characters of your postal code below. Home premiums are Rates.ca's Q2 2026 estimates for a 2,500 sq ft detached home; tenant premiums are its Q1 2026 estimates. Rows run from most to least expensive for homeowners.
| Postal code (FSA) | Avg. home premium | Avg. tenant premium |
|---|---|---|
| L4X | $2,355/yr (~$196/mo) | $296/yr |
| L4Y | $2,341/yr (~$195/mo) | $311/yr |
| L4T | $2,297/yr (~$191/mo) | $278/yr |
| L5E | $2,291/yr (~$191/mo) | $298/yr |
| L5G | $2,289/yr (~$191/mo) | $298/yr |
| L5H | $2,243/yr (~$187/mo) | $293/yr |
| L5B | $2,214/yr (~$184/mo) | $308/yr |
| L5J | $2,124/yr (~$177/mo) | $288/yr |
| L5A | $2,106/yr (~$176/mo) | $302/yr |
| L5R | $2,095/yr (~$175/mo) | $303/yr |
| L5K | $2,072/yr (~$173/mo) | $288/yr |
| L4Z | $2,068/yr (~$172/mo) | $299/yr |
| L5C | $2,015/yr (~$168/mo) | $332/yr |
| L4W | $1,991/yr (~$166/mo) | $292/yr |
| L5N | $1,990/yr (~$166/mo) | $301/yr |
| L5M | $1,987/yr (~$166/mo) | $288/yr |
| L5L | $1,920/yr (~$160/mo) | $285/yr |
| L5V | $1,889/yr (~$157/mo) | $277/yr |
| L5T | $1,877/yr (~$156/mo) | $292/yr |
| L5W | $1,859/yr (~$155/mo) | $265/yr |
| L4V | $1,755/yr (~$146/mo) | $268/yr |
| L5S | $1,700/yr (~$142/mo) | $265/yr |
Three things stand out. The five most expensive codes for homeowners (L4X, L4Y, L4T, L5E and L5G) are all above $2,280, and include the lakefront codes around Lakeview and Port Credit. The cheapest, L5S, is the airport-corporate belt bordering Malton, dominated by industrial and logistics land rather than dense housing. And the tenant ranking does not follow the home ranking: L5C (the Creditview, Mavis and Erindale area) has the city's highest tenant premium at $332 while sitting mid-table for homeowners, because tenant insurance prices contents and liability, not the building.
ThinkInsure's own customer data points the same way at the neighbourhood level: its Mississauga customers in Lorne Park pay the most and those in Meadowvale the least.
3. The two things actually driving 2026 increases
Province-wide, the 6.2% jump in home insurance premiums this year wasn't spread evenly across risk types. Two categories did most of the work:
System backup (sewer and septic overload)
This is damage from sewage or drain water backing up into a home, typically after heavy rain overwhelms municipal infrastructure. It's the fastest-growing risk category in Ontario, and it's concentrated in older urban cores — half of all Ontario FSAs flagged for high system backup risk are in the Greater Toronto and Hamilton Area. Mississauga's older neighbourhoods, built before modern stormwater systems, are more exposed to this than the city's newer subdivisions.
Wind and hail
The more geographically widespread of the two risks, affecting over a third of Ontario FSAs. Unlike system backup, this one isn't concentrated by urban age — it's closer to a general Southern Ontario weather pattern than a Mississauga-specific issue.
The backdrop here is a genuinely bad few years for insured losses. The Insurance Bureau of Canada recorded 2024 as the costliest year on record nationally, at $8.55 billion in insured damage, and Ontario's own 2024 summer floods alone accounted for roughly $1 billion of that. Premiums across the province have been catching up to that loss experience since.
4. What to actually do, depending on your situation
- Renters everywhere in the city: at $25–30/month on average, tenant insurance is inexpensive enough that skipping it rarely makes financial sense — your landlord's policy covers the building, not your belongings.
- Homeowners in the five priciest codes (L4X, L4Y, L4T, L5E, L5G): confirm your policy includes overland flood and sewer backup coverage specifically, and check your address against the TRCA floodplain map before assuming you're outside the risk zone.
- Condo owners in City Centre: your condo corporation's master policy covers the building; your own policy needs to cover contents, unit improvements, and the gap between your corporation's deductible and any special assessment.
- Anyone with an older home: ask specifically about system backup coverage limits — this is the fastest-rising cost category in Ontario right now, and older plumbing and sewer connections are more exposed to it.
- Everyone: a single small claim can cost more over time than paying out of pocket, once you factor in the loss of your claims-free discount. Save claims for genuinely significant losses.